Zytig
A Visualization Serving Patients and Doctors
Live Demo

C Awards 2017 - Zytig from Visualiseringscenter C on Vimeo.

Technology

Zytig is a web application based on react

React JS

React JS is a library for managing, changing, rendering web-based graphical user interfaces.

D3 JS

D3.js is the core behind the charts to visualize the information of patients.

Responsive

The platform is suitable to be viewed on desktops, mobile and tablets

ABOUT

Prostate cancer is the most common cancer among men, and yet most cases represent localized cancer for which the optimal treatment is unclear. There is a lack of patient-centered tools that can effectively communicate personalized risk information and enable them to make better health decisions. Zytig is a personalized health risk communication tool for prostate cancer patients and doctors.
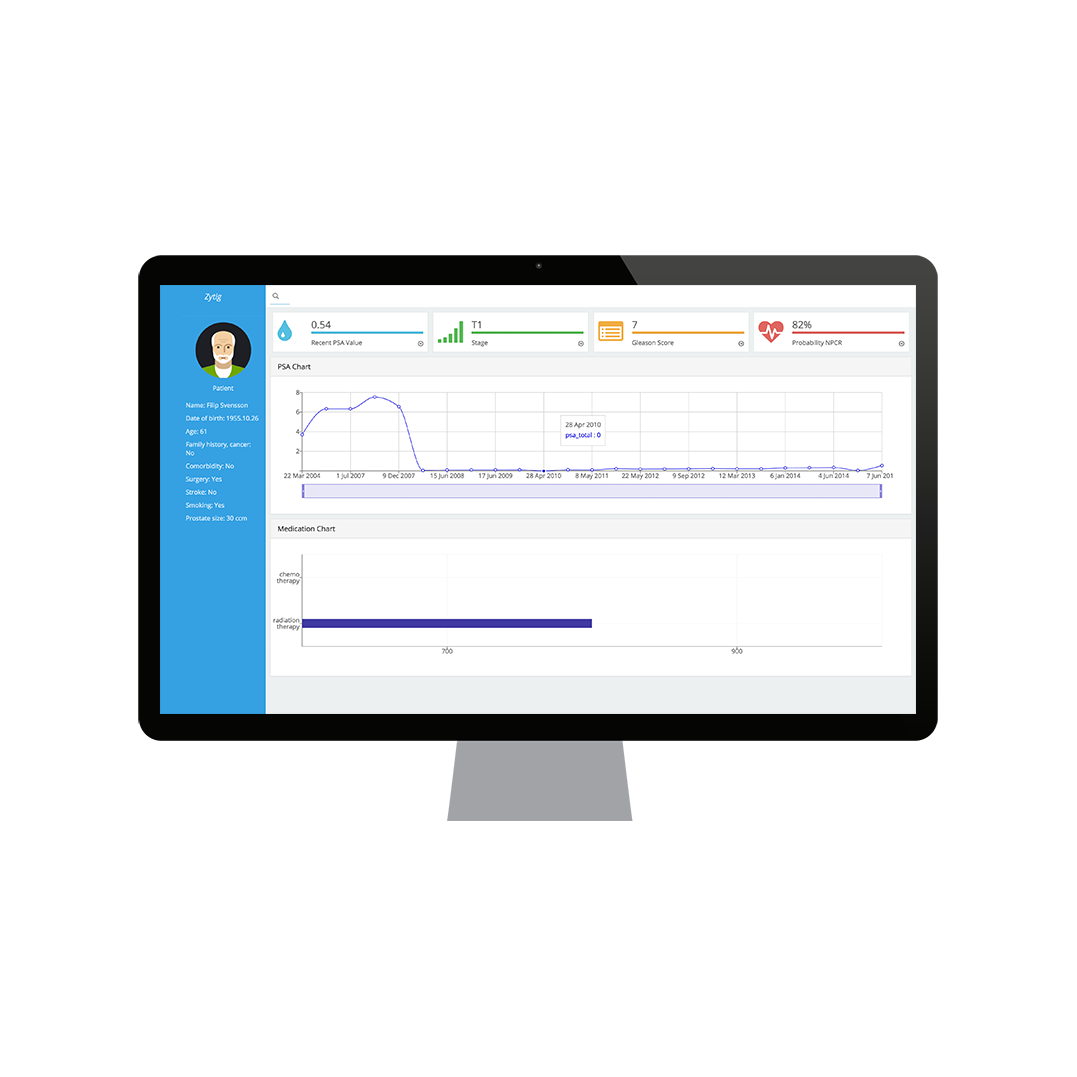
  • Patient Overview

    Zytig gives an integrative overview of patient data including medical history, a PSA chart and a timeline of medication as well as medical events such as biopsies and surgeries

  • Data Driven Decision Making

    By allowing physicians to quickly access medical charts and information in one place they decisions can be more informed and data driven

  • Quick access to relevant medical history

    Currently physicians have to look up the patients' medical history from multiple sources, some of them not even digitalized. With Zytig all this information is part of the same system

  • Integrated Statistics

    The Platform integrates relevant statistics from the National Prostate Cancer Register and has the potential to include relevant data from literature and other trusted academic and medical sources

Our Team

We are a group of young professionals currently pursuing our masters degree at KTH where we worked on Zytig as a course project for IVIS2017

Sara Eriksson

Designer

Sara was responsible for User Research, UX Design as well as shooting and editing of our C-awards submission video


Mohit Ahuja

Developer, Designer And Storyteller

Mohit mainly worked on developing and deploying Zytig but was also involved with the design and user testing


Matyas Tomolya

Developer

Matyas was responsible for developing, implementing the frontend of the system


Dora Palfi

Designer and Developer

Dora was working with the design, testing and development of the data visualizations in Zytig as well as for creating this website


Mustafa Saeed

Developer

Mustafa was in charge of setting up React and for putting the small bits programmed by all of us together


Fanny Chan

Designer & Developer

Fanny worked with user testing, coordinating meetings with doctors and developing the visualizations.


Finally, thank you Mario for the great course and Karolinska & Janssen for letting us be part of an impactful project!